How User Analytics Improves Knowledge Base Content
Leverage user analytics to enhance knowledge base content by tracking user behavior, improving self-service options, and optimizing resource use.


Here’s the deal: Without tracking how users interact with your KB, you're guessing at what works. Analytics help you understand what users need and how to improve. Key benefits include:
- Fewer support tickets: Users solve problems on their own.
- Better content performance: Articles deliver real value.
- Improved user experience: Clearer, easier-to-navigate content.
5 Metrics to Track:
- Page Views: See which articles are popular (or not).
- Search Success: Check what users search for - and if they find it.
- Reading Time: Measure if articles are too short, too long, or just right.
- User Feedback: Ratings and comments show what needs fixing.
- Exit Pages: Spot where users leave your KB without answers.
How to Use This Data:
- Regularly update articles based on user behavior.
- Create new content for unanswered questions.
- Organize articles so users find what they need faster.
Tools like HelpJam offer AI-driven insights, search term analysis, and feedback tracking to make this process easier. By focusing on data, you can build a KB that truly helps users while reducing support load.
How User Analytics Improve KB Content
Data vs. Guesswork in KB Management
Using data instead of relying on assumptions can greatly improve the effectiveness of your knowledge base (KB). Analytics show how users interact with your content, helping you make informed decisions about what needs improvement.
Tracking user behavior lets you:
- Spot usage trends and gaps by analyzing search data and exit pages
- Pinpoint content issues through engagement metrics and user feedback
- Focus updates on areas with high traffic or user confusion
For instance, analyzing search terms reveals the exact words your users use when seeking help. This allows you to match your article titles and content to their vocabulary, making it easier for them to find what they need.
These insights support regular updates that make self-service tools more effective.
Results of Regular KB Updates
Using these data insights to guide consistent updates can lead to measurable improvements in your KB's performance.
Faster Self-Service Solutions
- Users can quickly find the answers they need without contacting support.
- Less time is spent searching for information.
Efficient Use of Resources
- Support teams can focus on resolving complex issues.
- Content creators can prioritize updates that have the most impact.
- Maintenance efforts can target the most critical articles.
Better User Experience
- Easier navigation through related articles.
- Clearer, more user-focused content.
- Quicker problem-solving for users.
A consistent review process is key. This involves:
- Monitoring user interaction data.
- Identifying patterns and problem areas.
- Updating content based on how users actually engage with it.
- Tracking improvements in key performance metrics.
5 Key KB Metrics to Track
Keeping an eye on the right metrics helps you understand user behavior and pinpoint areas for improvement. Below are the key metrics to measure your knowledge base's performance:
Page Views and Reader Engagement
Page views highlight which articles draw the most attention and which might need better exposure. Track both total views and unique visitors to dig deeper:
- Article popularity: High-traffic articles often highlight common user issues.
- Seasonal trends: Certain articles may see spikes at specific times, helping you plan updates.
Focus on high-traffic articles with low engagement for quick improvements.
Search Patterns and Success
Search data shows what users are looking for and whether they find it. Pay attention to:
- Popular search terms: These reveal the language your users use.
- Failed searches: Terms that return no results or lead to bounces.
- Search refinements: Users refining searches may indicate unclear content.
Align your article language with the search terms users commonly use.
Reading Time per Article
How long users spend on an article can tell you a lot about its effectiveness:
| Reading Duration | Possible Meaning | Suggested Action |
|---|---|---|
| Less than 30 seconds | Content may be too shallow or unclear | Add more detail or refocus |
| 2–4 minutes | Ideal engagement for most articles | Keep monitoring |
| More than 5 minutes | Content might be too dense or complex | Simplify and break it into sections |
Optimize articles where reading time doesn't match the content's complexity.
User Ratings and Comments
Ratings and comments offer direct feedback on content quality:
- Positive ratings: Learn what works and replicate it.
- Negative feedback: Flag these articles for immediate updates.
- Recurring comments: Look for patterns to address common issues.
Prioritize high-traffic articles with low ratings for updates.
Exit Page Analysis
Tracking where users leave your knowledge base can reveal whether they found what they needed:
- High exit rates on short visits may indicate unclear or unhelpful content.
- Exit rates after longer visits often suggest users found their answers.
- Next steps such as contacting support can show if the content missed the mark.
Identify and improve articles with high exit rates that lead to support inquiries.
These metrics give you a clear picture of your knowledge base's performance, helping you make data-driven updates that truly matter.
HelpJam's KB Analytics Tools
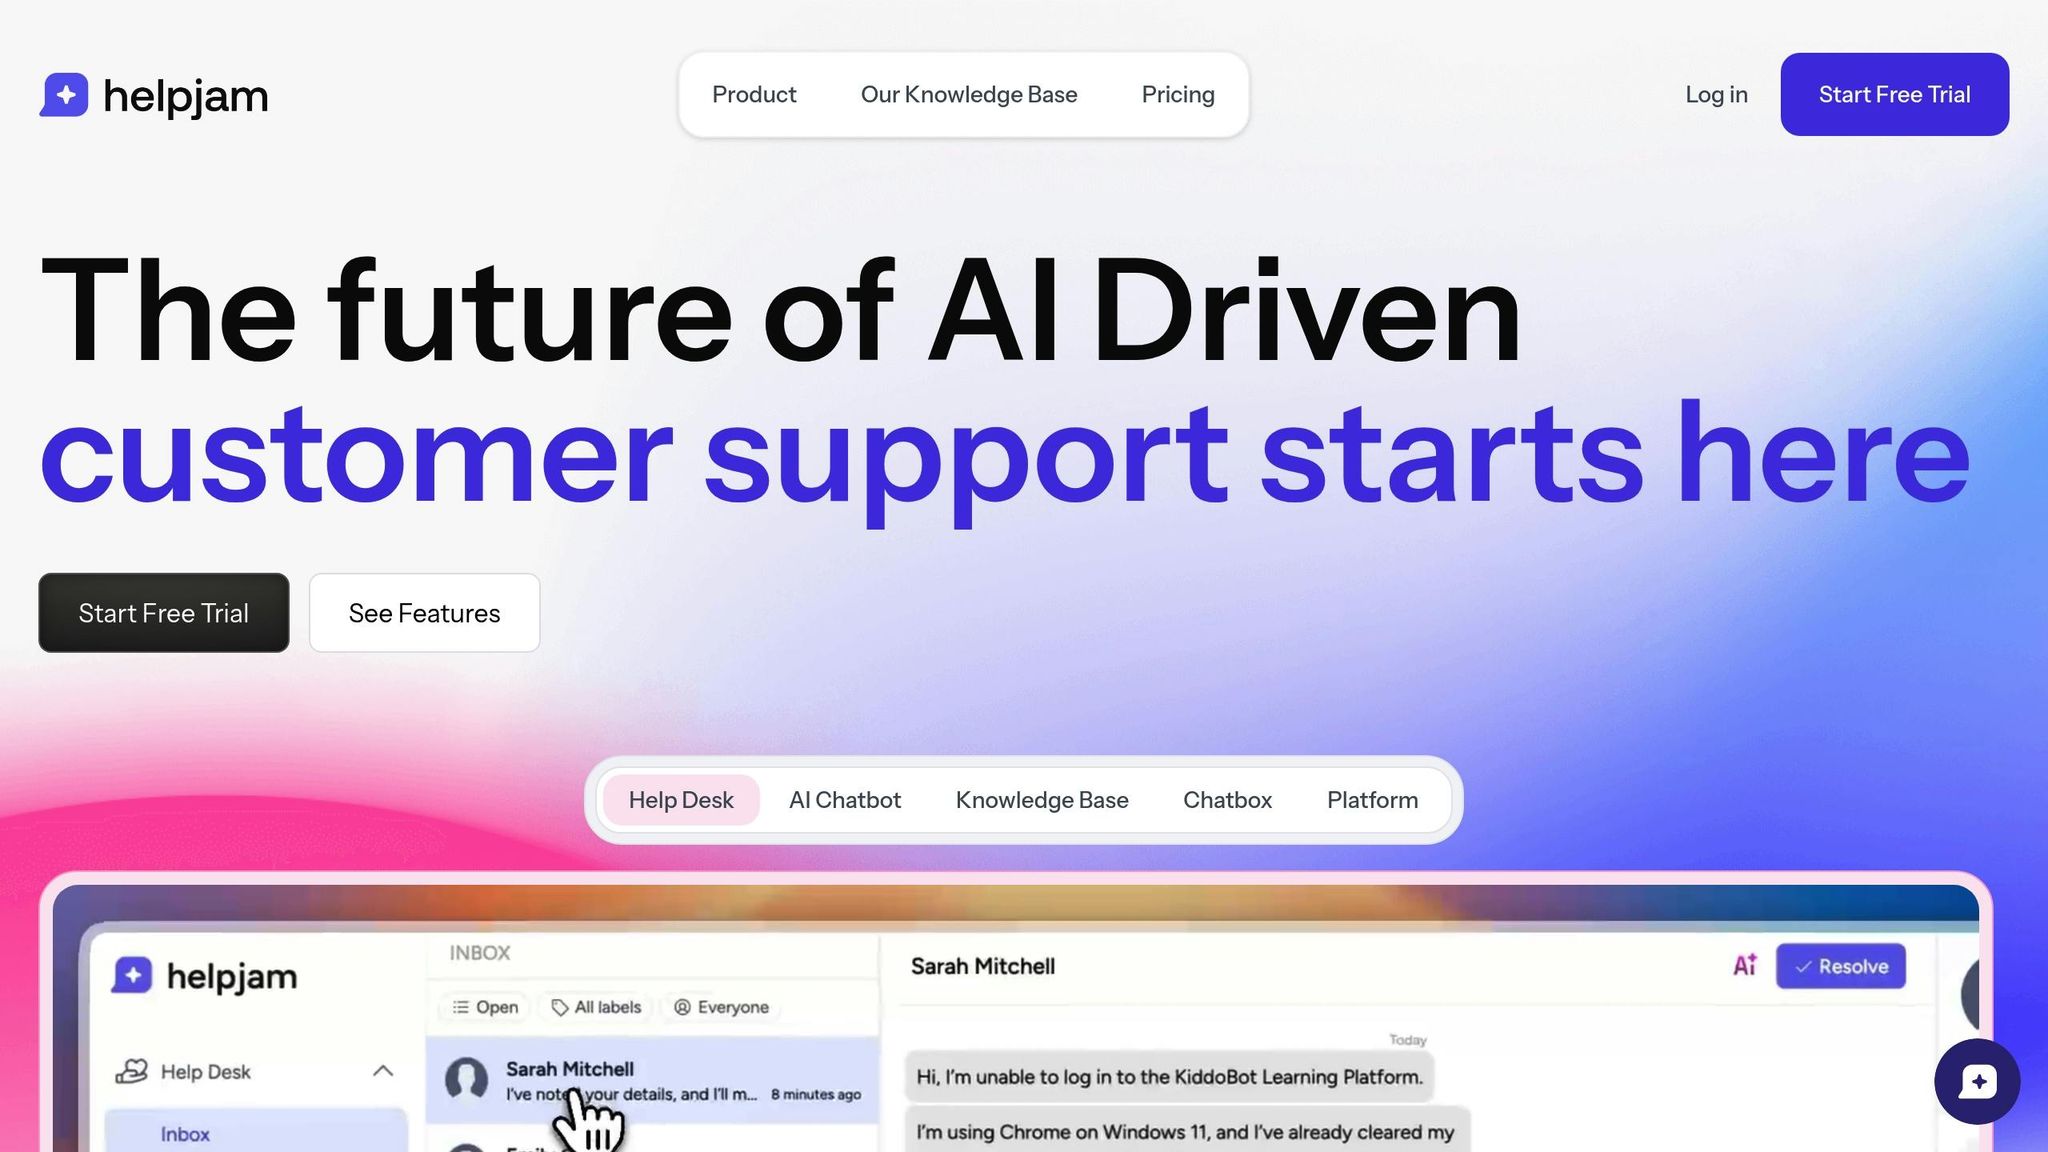
HelpJam takes raw data and turns it into clear, actionable steps for improving your knowledge base (KB). Here’s how their tools help optimize your content:
AI Content Suggestions
HelpJam evaluates article performance and user behavior to identify areas for improvement. It highlights articles needing changes based on:
- Readability scores: Pinpoints sections with overly complex language.
- Engagement patterns: Identifies when users leave without finding what they need.
- Content gaps: Flags missing topics based on frequent search queries.
- Structure improvements: Suggests clearer formatting or breaking up long paragraphs.
The system might recommend simplifying language, adding subtopics, or reorganizing content for better clarity.
Search Term Analysis
HelpJam’s search analytics dashboard monitors user queries in real time, helping you understand:
| Search Pattern | What It Reveals | Next Step |
|---|---|---|
| Failed searches | Missing content | Create new articles |
| Similar terms | Inconsistent terminology | Standardize language |
| Seasonal trends | Time-sensitive needs | Plan timely updates |
| Regional variations | Local preferences | Refine translations |
This tool helps you focus your content efforts where they’ll make the biggest difference.
Built-in Feedback System
HelpJam’s feedback tools make it easy to gather user input directly within articles:
- Quick reaction buttons: Let users indicate if an article was helpful.
- Detailed feedback forms: Allow for optional suggestions.
- Smart prompts: Triggered by signs of user confusion.
- Automated follow-ups: Request feedback on low-rated articles.
By analyzing this feedback, you can prioritize which articles need immediate updates versus long-term adjustments.
Language Performance Tracking
For multilingual knowledge bases, HelpJam offers region-specific insights to ensure quality across all languages:
- Translation effectiveness: Compares the performance of translated content to the original.
- Regional engagement: Tracks which languages and regions drive the most traffic.
- Cultural relevance: Highlights content that may need local adjustments.
- Search term variations: Shows how users in different regions phrase similar queries.
The system flags underperforming translations, helping you maintain consistent quality and relevance across regions.
These tools work together to keep your KB aligned with user needs, ensuring your content stays accurate, accessible, and useful. By focusing on user behavior, HelpJam enables smarter, data-driven content management.
Using Data to Update KB Content
Regular Content Reviews
Keeping your knowledge base (KB) up-to-date requires regular reviews. Focus on articles flagged by user metrics to maintain quality and relevance:
High-Priority Updates:
- Articles with ratings below 3 stars
- Pages showing bounce rates over 80%
- Content with fewer views over time
- Articles users consistently mark as outdated
Plan quarterly reviews using performance data, especially for technical documentation and feature-related content that needs updates after product changes.
Once existing content is refreshed, use the data to identify gaps and create new articles that address user needs.
Creating Articles Users Need
Search analytics can guide the creation of new KB articles that truly help users:
Focus on Search Gaps:
- Identify gaps where users search but find no results
- Track support ticket topics that lack KB coverage
- Review chat transcripts for recurring questions
When drafting new content, use the language and terms your users actually use, not just internal jargon. This makes the articles more relatable and easier to find.
Finally, ensure these new articles are well-organized and simple to navigate.
Making Content Easier to Find
Even the best content is only useful if users can locate it quickly.
Improve Article Organization:
- Group related articles into clear, interlinked clusters
- Use consistent naming conventions
- Tag articles with common search terms
- Adjust titles to match popular search queries
Enhance Navigation:
- Highlight high-traffic articles in prominent positions
- Add internal links between related articles
- Use clear, descriptive headings within articles
Leverage HelpJam's analytics dashboard to monitor performance. Articles that are well-organized and easy to navigate tend to have better engagement and higher satisfaction ratings.
Optimization Tips:
- Update meta descriptions regularly
- Include synonyms for key terms to improve searchability
- Break lengthy articles into smaller, focused sections
- Incorporate visuals where they add clarity or value
Conclusion
Using the strategies outlined earlier, businesses can transform static documentation into a dynamic, ever-improving resource. By monitoring key metrics, teams can make smarter decisions about updating and creating content.
HelpJam’s analytics suite offers real-time insights and AI-powered recommendations. With it, teams can:
- Pinpoint content gaps through search data
- Analyze user engagement trends
- Receive actionable suggestions for improvement
These tools help support teams tackle potential issues early. Instead of waiting for customer complaints or support tickets, teams can use metrics like dropping engagement rates or rising exit rates to identify and address problems before they grow.