Key Metrics for Evaluating Support Performance
Explore key metrics that enhance support team efficiency, streamline issue resolution, and boost customer satisfaction.

Here are 8 key metrics that can help your support team improve efficiency, resolve issues faster, and keep customers happy:
- First Response Time (FRT): How quickly agents reply to new tickets.
- Time to Resolution: Total time taken to resolve a ticket.
- Customer Satisfaction (CSAT): Percentage of positive survey responses.
- Support Volume Analysis: Tracks ticket trends and peak times.
- Self-Service Success Rate: Measures how effective your knowledge base and chatbots are.
- One-Touch Resolution Rate: Tickets solved in a single interaction.
- Team Workload Distribution: Ensures tickets are evenly spread across agents.
- Customer Message Sentiment: Analyzes tone to identify urgent cases.
Why it matters: These metrics reveal what's working, what needs fixing, and how to deliver faster, better support.
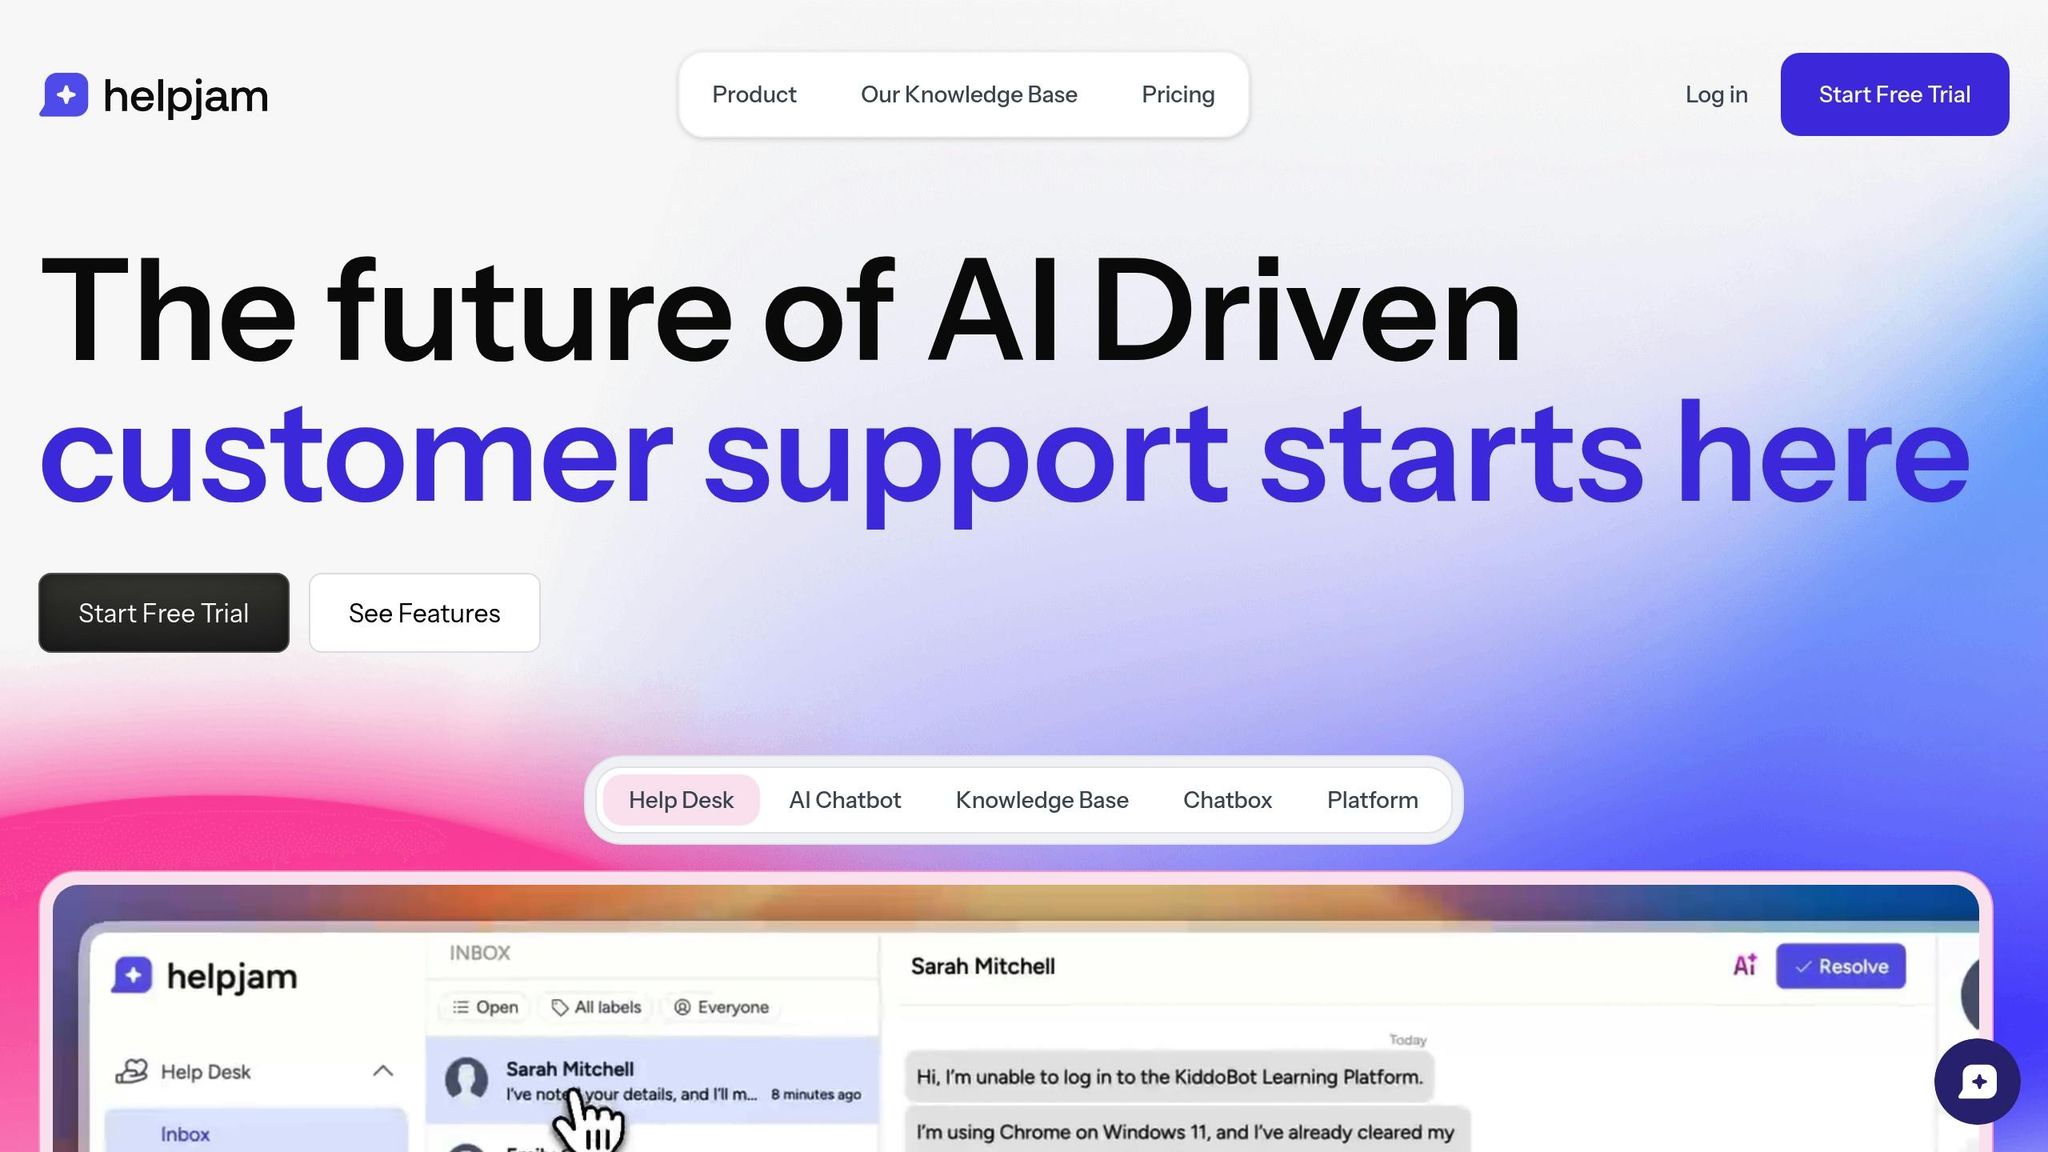
Tool to try: HelpJam’s analytics tools offer real-time dashboards, AI insights, and reporting to track all these metrics. Plans start at $0/month.
8 Core Support Performance Metrics
1. First Response Time (FRT)
This metric tracks how quickly agents respond to new inquiries, reflecting how much a company values its customers’ time. A faster response sets the tone for a positive support experience.
2. Time to Resolution
Time to Resolution measures how long it takes to resolve a ticket, from creation to closure. It’s a key way to spot inefficiencies and identify areas where staff training might be needed. HelpJam provides detailed breakdowns by ticket type, agent, and department.
3. Customer Satisfaction Scores
CSAT surveys let customers rate their experience on a 1-5 scale. HelpJam makes it easy by sending surveys automatically after tickets are resolved. Results are then grouped by trends, agent performance, ticket type, and response quality.
4. Support Volume Analysis
This metric examines ticket trends over time - daily, weekly, and monthly. It highlights peak hours, common issues, and seasonal surges, helping teams plan staffing and address recurring problems.
5. Self-Service Success Rate
This measures how effective self-service tools like knowledge bases and chatbots are. By analyzing article views, chatbot resolutions, and the ratio of self-service to agent-assisted outcomes, teams can see where improvements are needed.
6. One-Touch Resolution Rate
This metric shows the percentage of tickets resolved in a single interaction. It’s a sign of well-trained agents and efficient workflows.
7. Team Workload Distribution
Workload Distribution tracks how tickets are spread across agents, average handling times, and active versus idle periods. It also considers skill-based routing to prevent overloading certain team members.
8. Customer Message Sentiment
Sentiment Analysis identifies the tone and urgency of customer messages. By spotting frustration or escalation cues, agents can prioritize critical cases and respond appropriately.
HelpJam’s Support Analytics Tools bring all these metrics together on a real-time dashboard, making it easier to monitor and improve performance.
HelpJam's Support Analytics Tools

HelpJam provides teams with three powerful tools to monitor and manage the eight core metrics effectively, all in real time.
Performance Dashboard Features
The real-time dashboards offer a clear view of key metrics like First Response Time (FRT), resolution time, Customer Satisfaction (CSAT), ticket patterns, and sentiment analysis. They also track inbox and chatbot activity for a complete picture.
AI Performance Analysis
HelpJam's AI engine analyzes conversations to identify trends, highlight recurring questions, and recommend updates or additions to your knowledge base.
Built-in Reporting Tools
Easily create, export, or share reports on any metric directly within HelpJam. There's no need for external tools - everything is handled in one place.
Support Metrics Quick Reference
Here’s a quick overview of key support metrics and their impact:
| Metric | Definition | Business Impact |
|---|---|---|
| First Response Time (FRT) | Time from ticket creation to the first agent reply | Affects customer satisfaction and perceived responsiveness |
| Time to Resolution | Total time from ticket creation to resolution | Measures support efficiency and customer effort |
| Customer Satisfaction (CSAT) | Percentage of positive post-interaction survey responses | Reflects service quality and customer experience |
| Support Volume | Number of tickets handled | Helps plan staffing and identify busy periods |
| Ticket Deflection Rate | Percentage of users solving issues without agent help | Lowers costs and improves scalability |
| First Contact Resolution (FCR) | Percentage of issues solved in one interaction | Highlights team efficiency and knowledge base effectiveness |
| Team Workload Distribution | Active tickets per agent | Prevents burnout and maintains service consistency |
| Customer Message Sentiment | AI analysis of customer tone in messages | Flags urgent cases and avoids escalations |
Up next: See how HelpJam's dashboard tracks these metrics in real time.
Try HelpJam's Analytics Tools
Now that you know which KPIs to focus on, here's how to keep track of them.
You can monitor FRT, CSAT, resolution time, ticket volume, and sentiment - starting at $0/month.
- Free Plan: Includes a basic dashboard for tracking volume and response time, 10 GB of storage, and one workspace.
- Starter Plan ($49/month): Offers a custom domain and AI-powered insights.
- Growth Plan ($99/month): Adds multi-workspace analytics.
- Business Plan ($199/month): Provides enterprise-level reporting and unlimited storage.
Get Started Fast: Sign up at HelpJam Free AI Chatbot, set up your workspace, connect your channels, and start viewing real-time metrics instantly.


